|
My name is Jun Yuan. I'm currently working at Apple Vision Products Group. I design and develop interactive visual analytics systems to help machine learning model developers understand their model's behaviors and performance. I obtained my Ph.D. degree from New York University in Computer Science, advised by Prof. Enrico Bertini at Visualization Imaging and Data Analysis Center (VIDA) Lab. My research interest lies in the intersection of Explainable AI (xAI) and Data Visualization. Before joining NYU, I received my bachelor’s degree in Software Engineering from Fudan University, Shanghai, China. CV / Google Scholar / LinkedIn |

|
|
|
|
[Mar 2025] Our paper Towards a Better Evaluation of 3D CVML Algorithms: Immersive Debugging of a Localization Model got accepted by EuroVis'25. [Jan 2025] Our paper VibE got accepted by IUI'25. [June 2024] I'm giving a guest lecture at University of California, Berkeley, class DS100 Data, for “Visualization II”. |
|
|
|
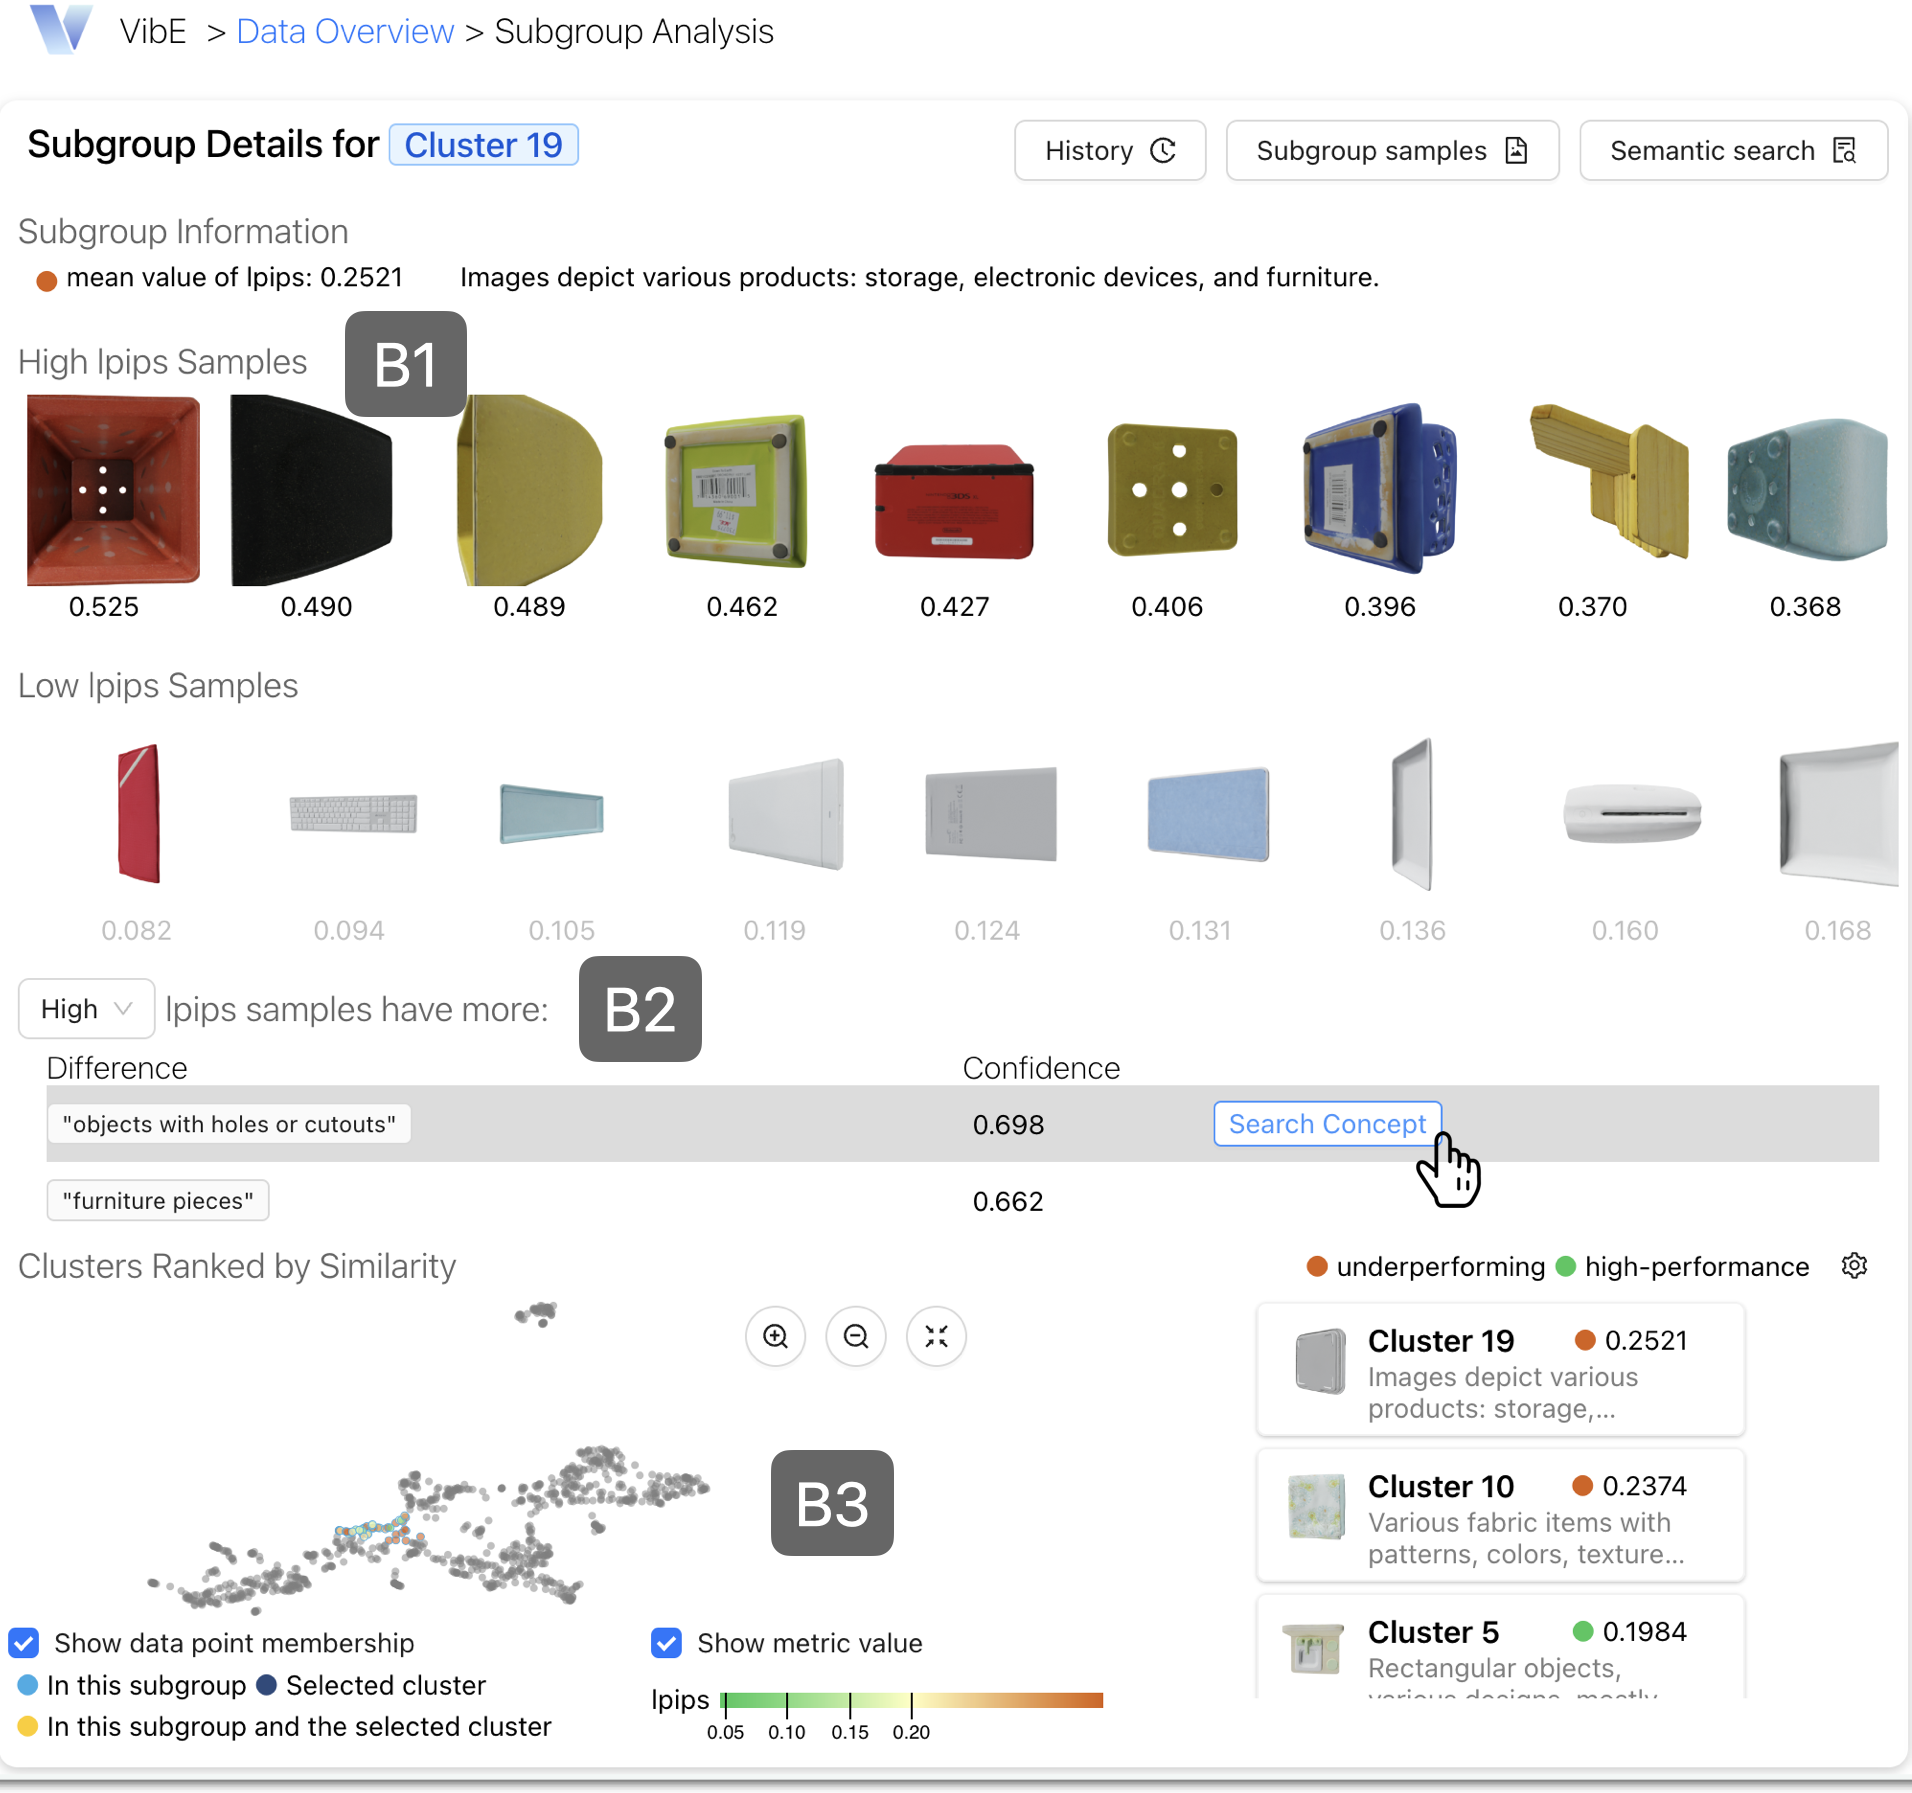
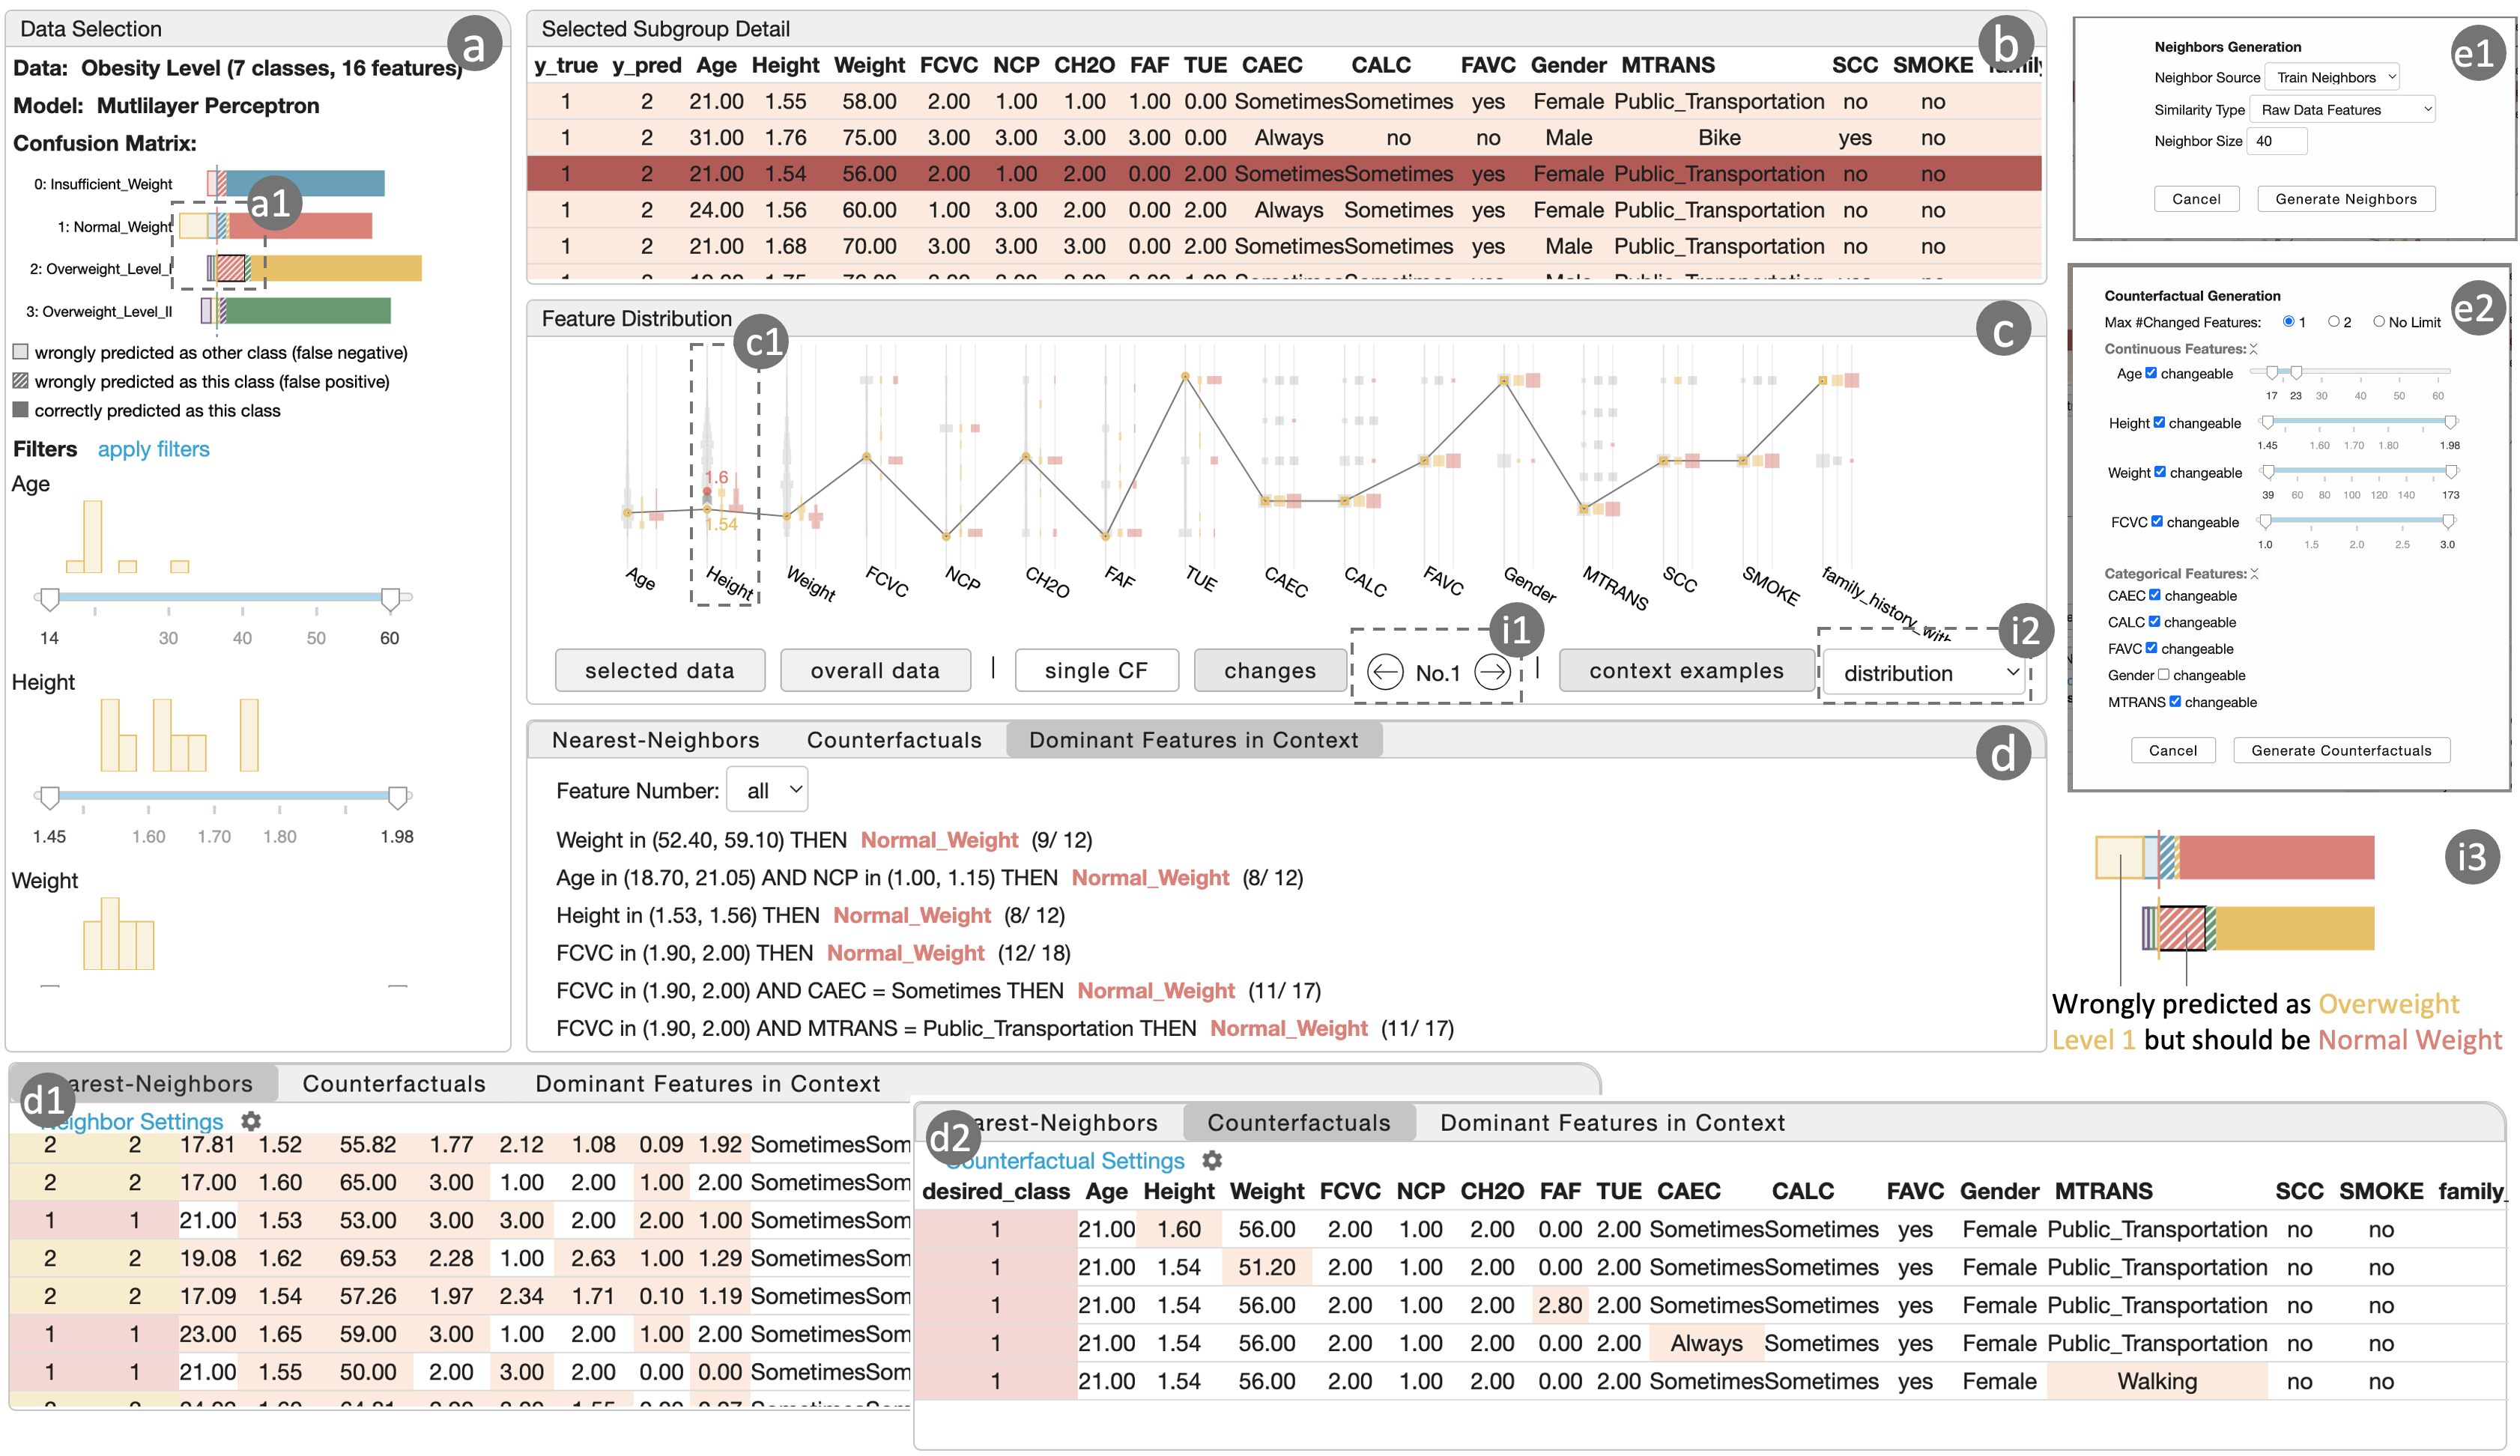
Jun Yuan, K. Miao, H. Oh, I. Walker, Z. Xue, T. Katolikyan, M. Cavallo. ACM IUI, 2025 arXiv / paper By leveraging large foundation models (such as CLIP and GPT-4) alongside visual analytics, VibE enables developers to semantically interpret and analyze CVML model errors. This interactive workflow helps identify errors through subgroup discovery, supports hypothesis generation with auto-generated subgroup summaries and suggested issues, and allows hypothesis validation through semantic concept search and comparative analysis. |
|
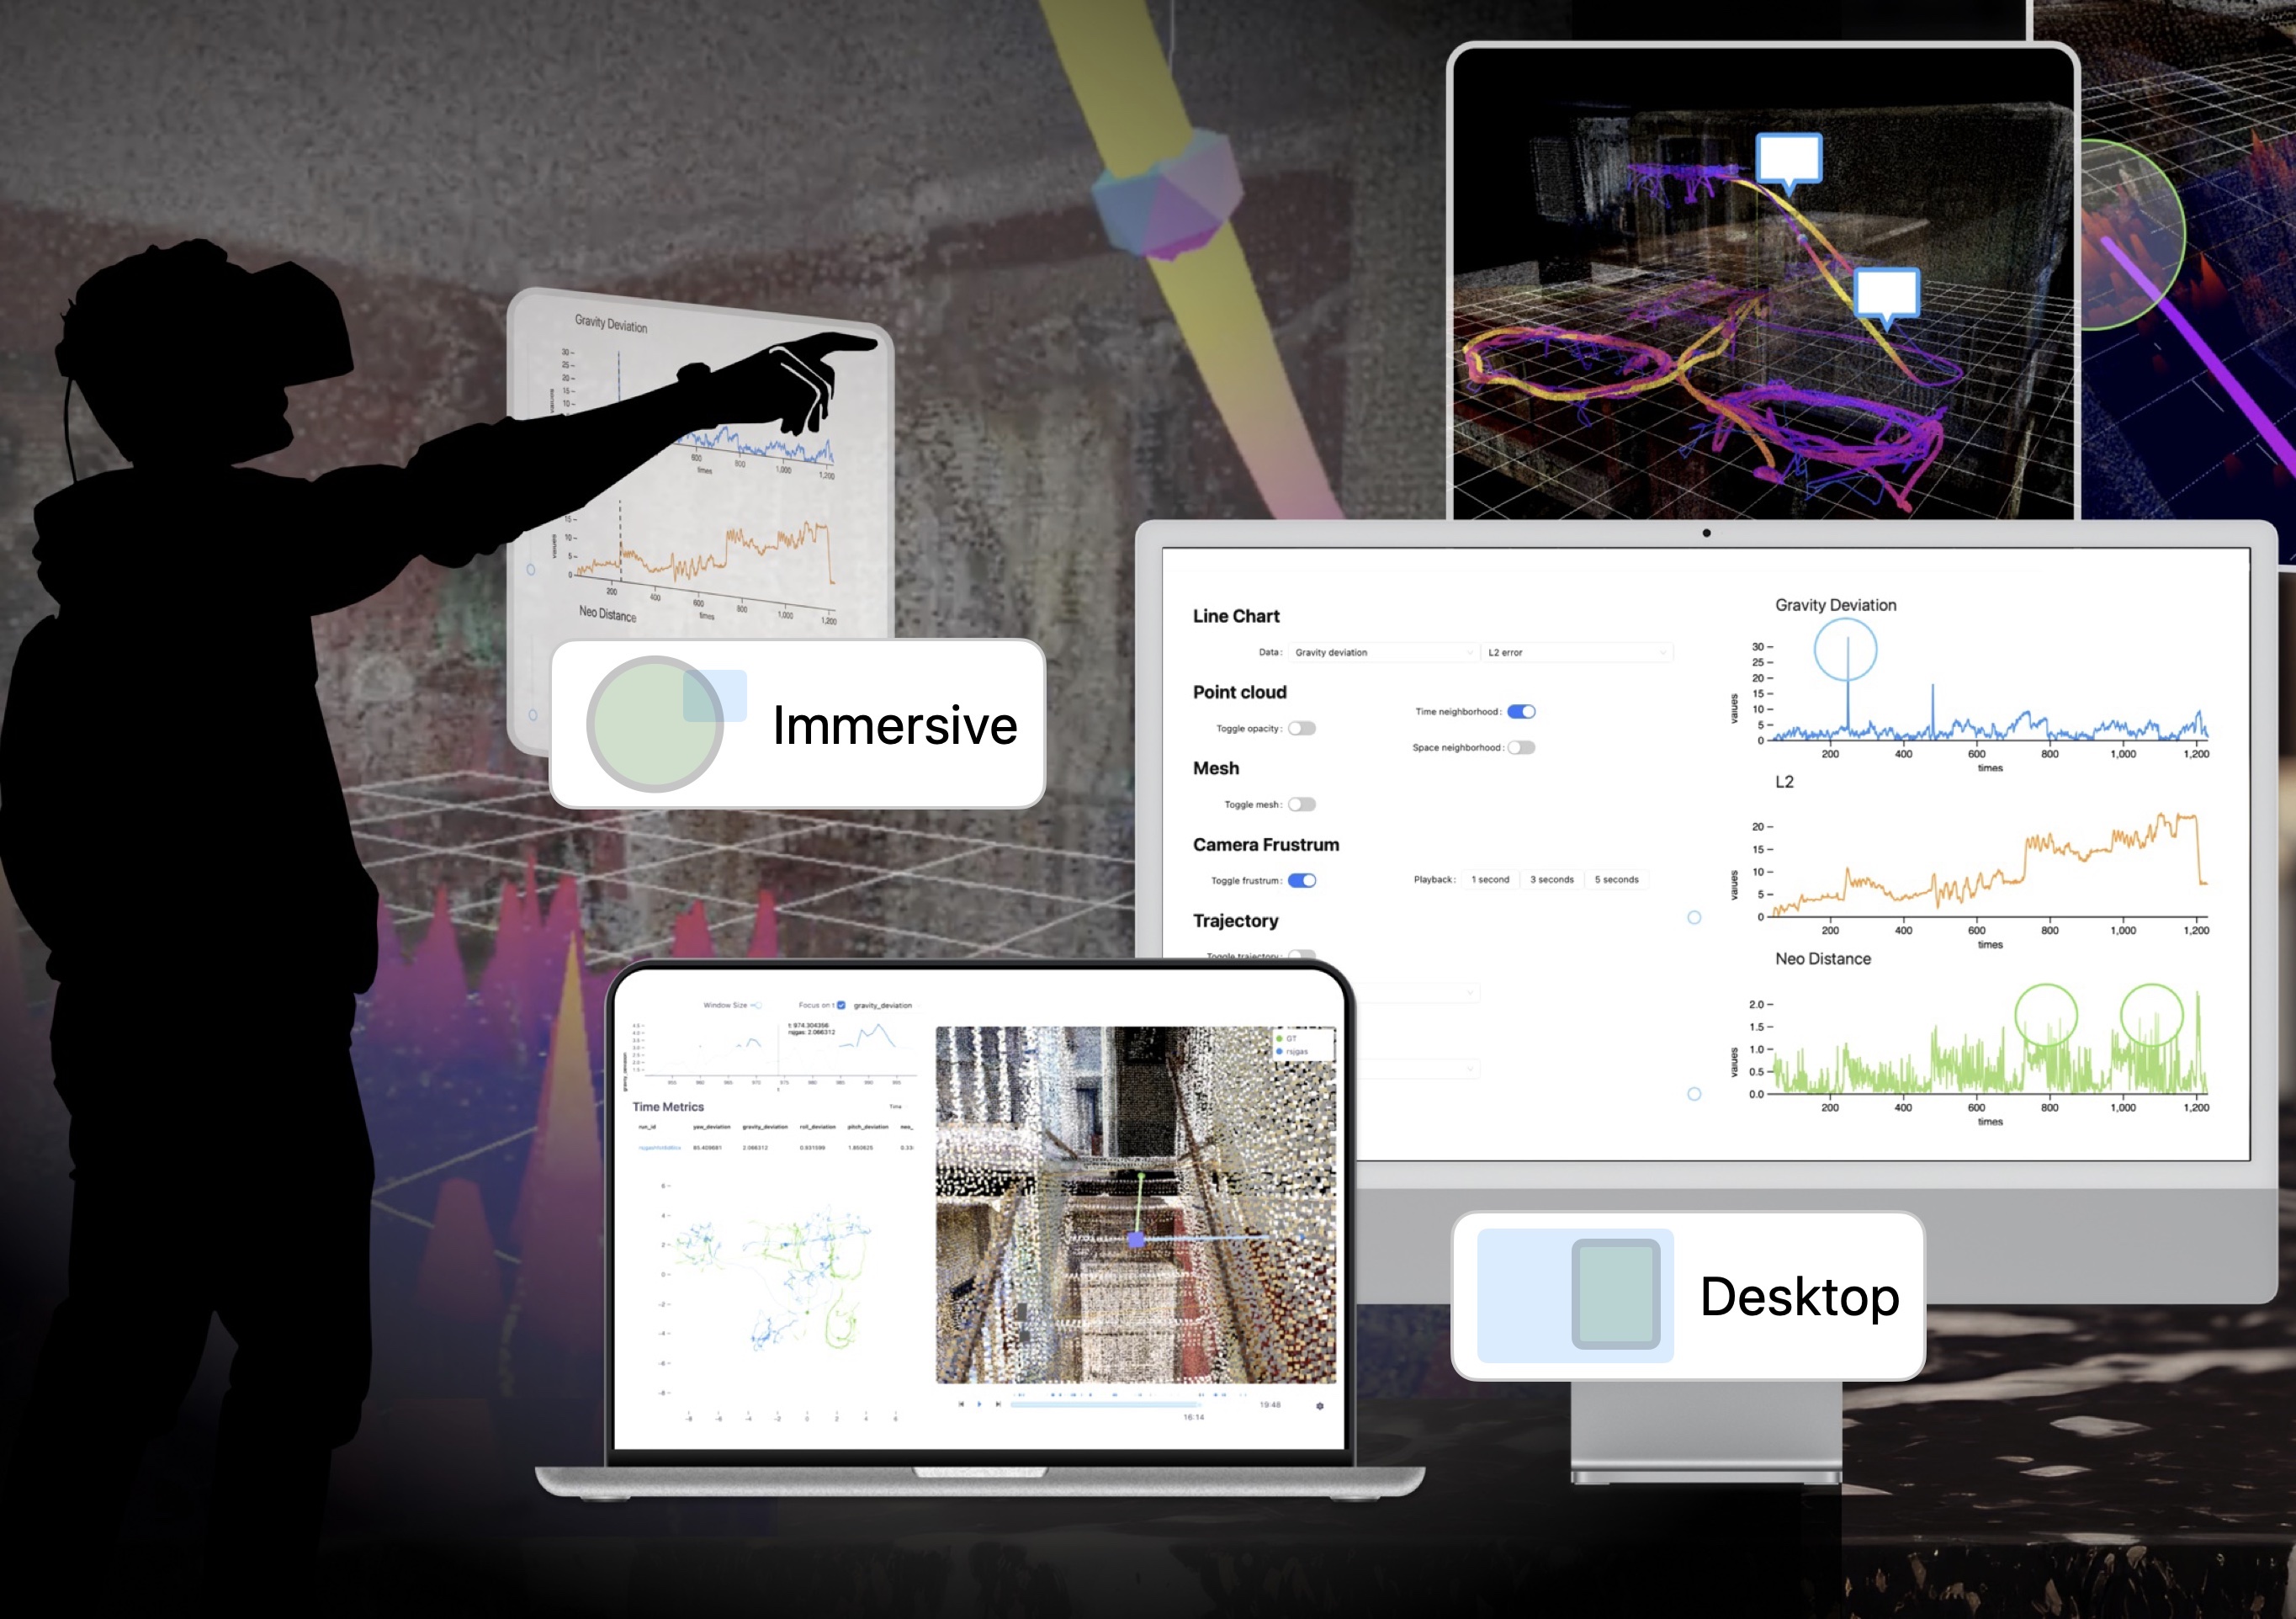
Tica Lin, Jun Yuan, Kevin Miao, Isaac Walker, Tigran Katolikyan, Marco Cavallo. Computer Graphics Forum, 2025 paper In this paper, we explore the application of Immersive Analytics (IA) methodologies to enhance the debugging process of 3D CVML models. Based on the insights we gained from in-depth interviews with eight CVML engineers, we propose a novel immersive analytics system for debugging an indoor localization algorithm and present it in Apple Vision Pro. |
|
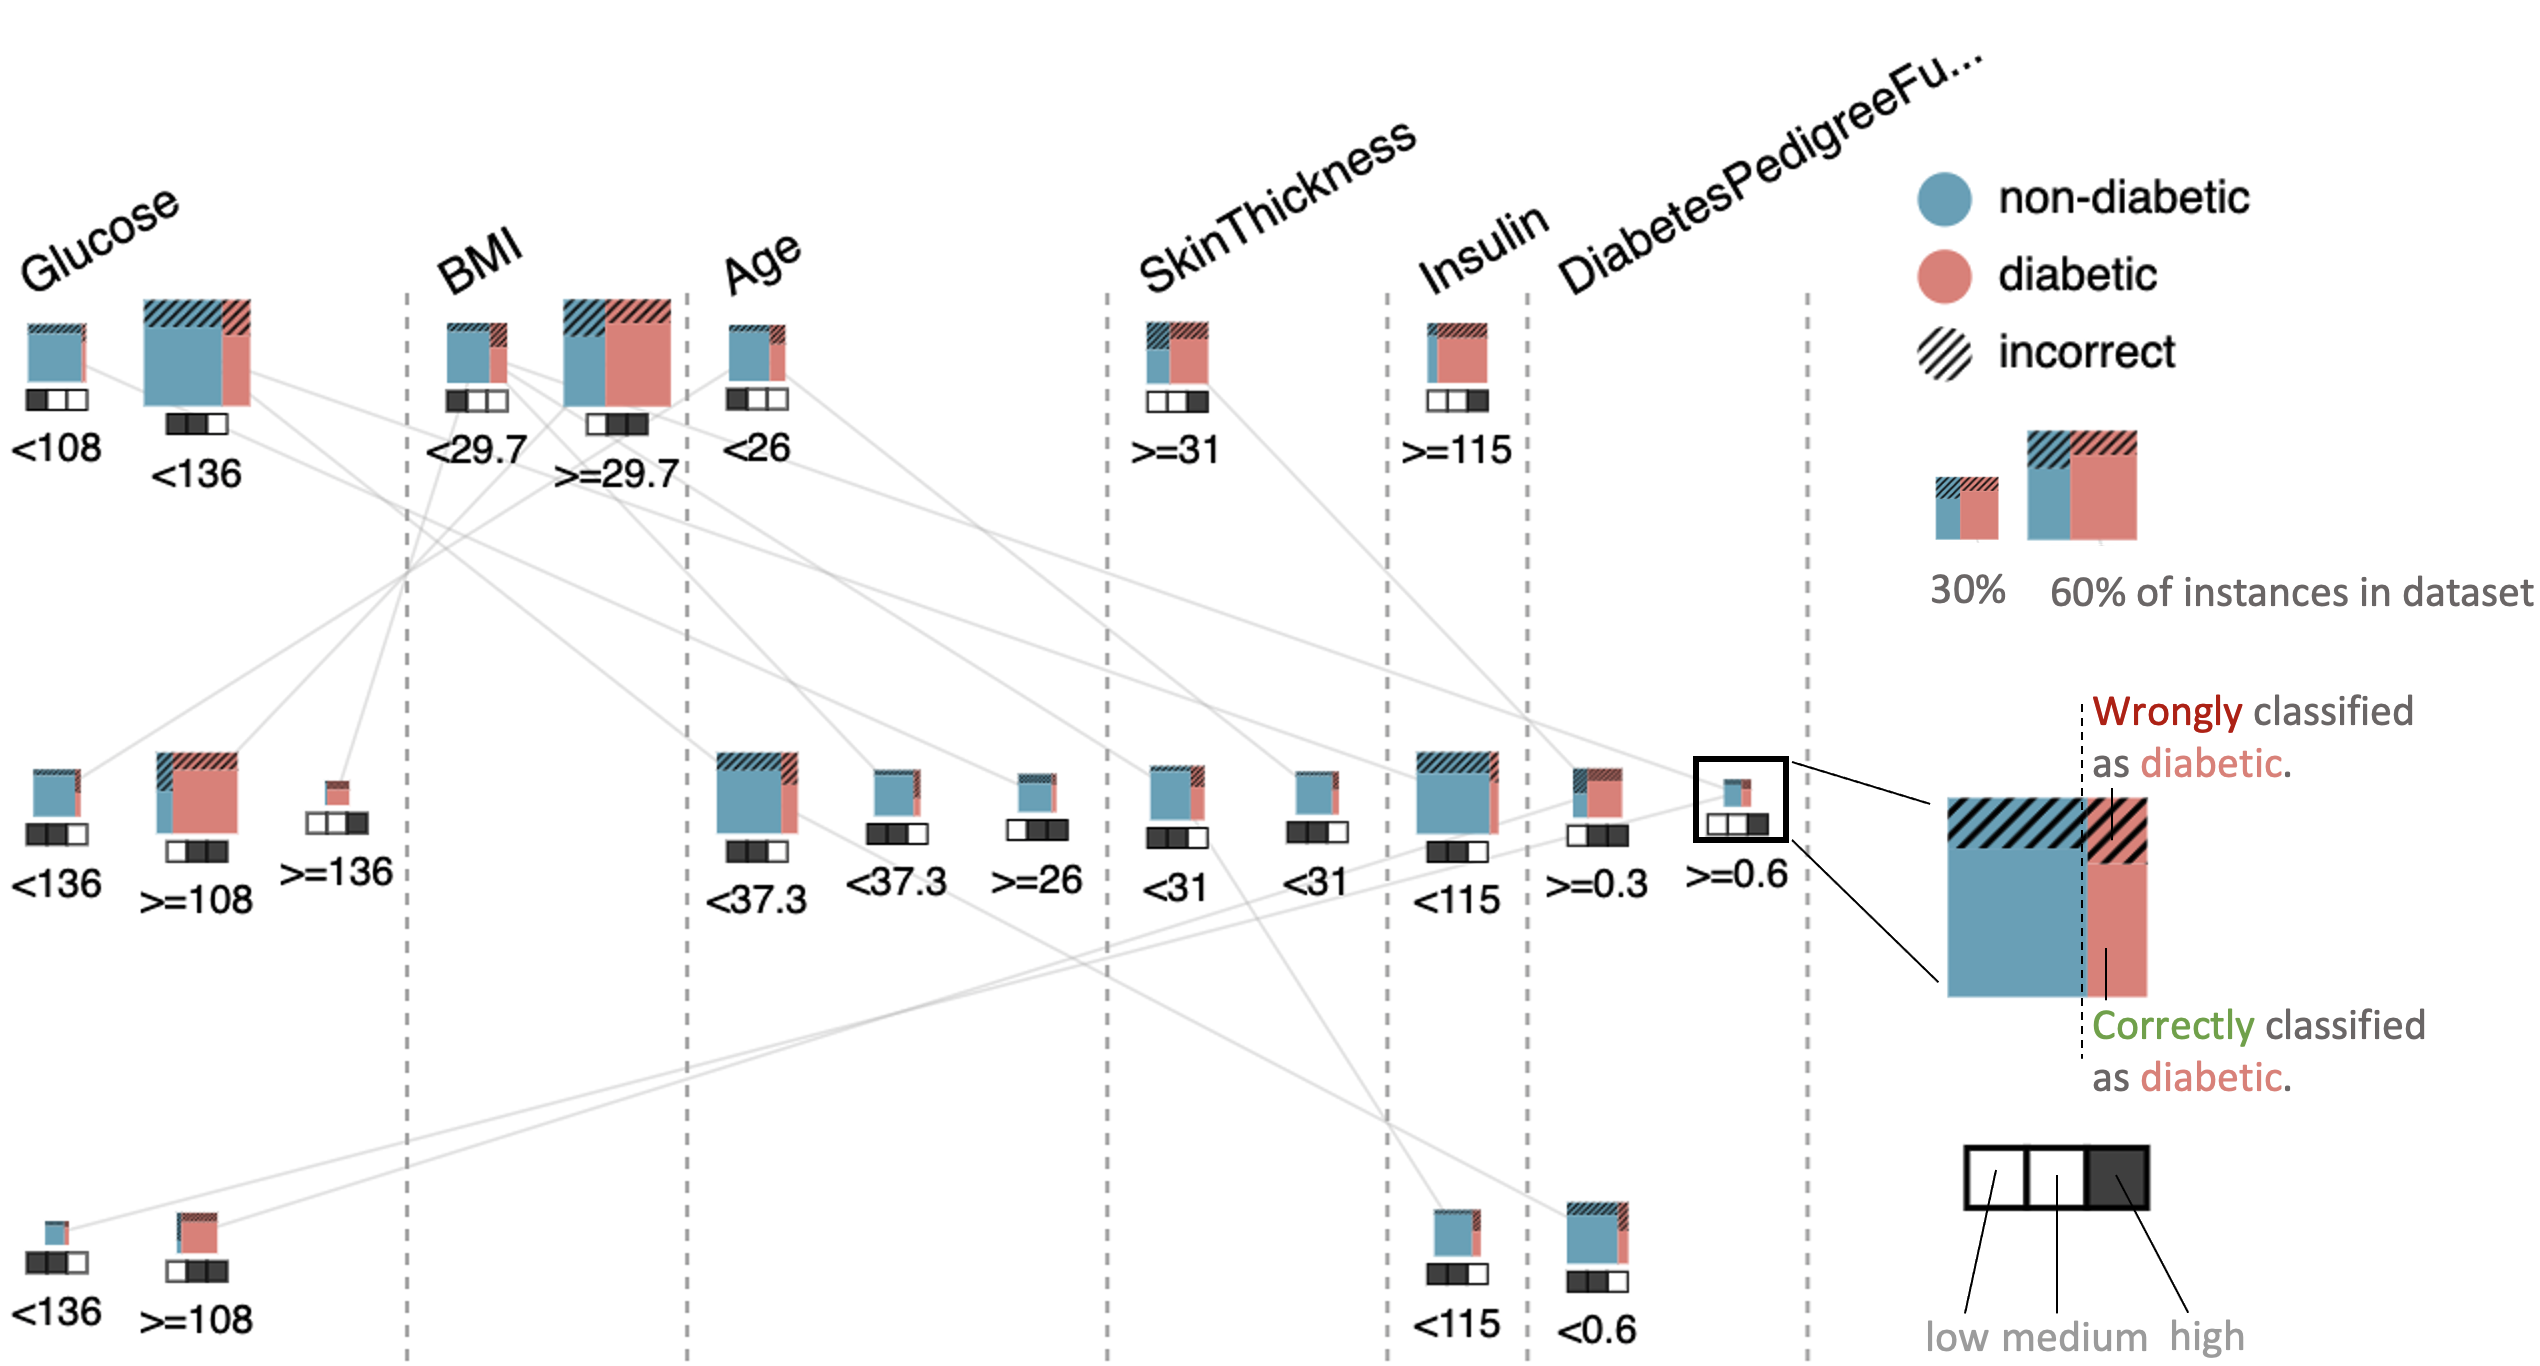
Jun Yuan, Brian Barr, Kyle Overton, Enrico Bertini. IEEE Transactions on Visualization and Computer Graphics (TVCG) arXiv / video / github / evaluation In this paper, we contribute SURE, a visual analytics system that integrates an algorithmic and interactive solution to generate and visualize surrogate rules to help people understand model behaviors. Our validation studies with this system leads to many interesting findings, including a task taxonomy for rule analysis, that can be used for visualization design and future research. |
|
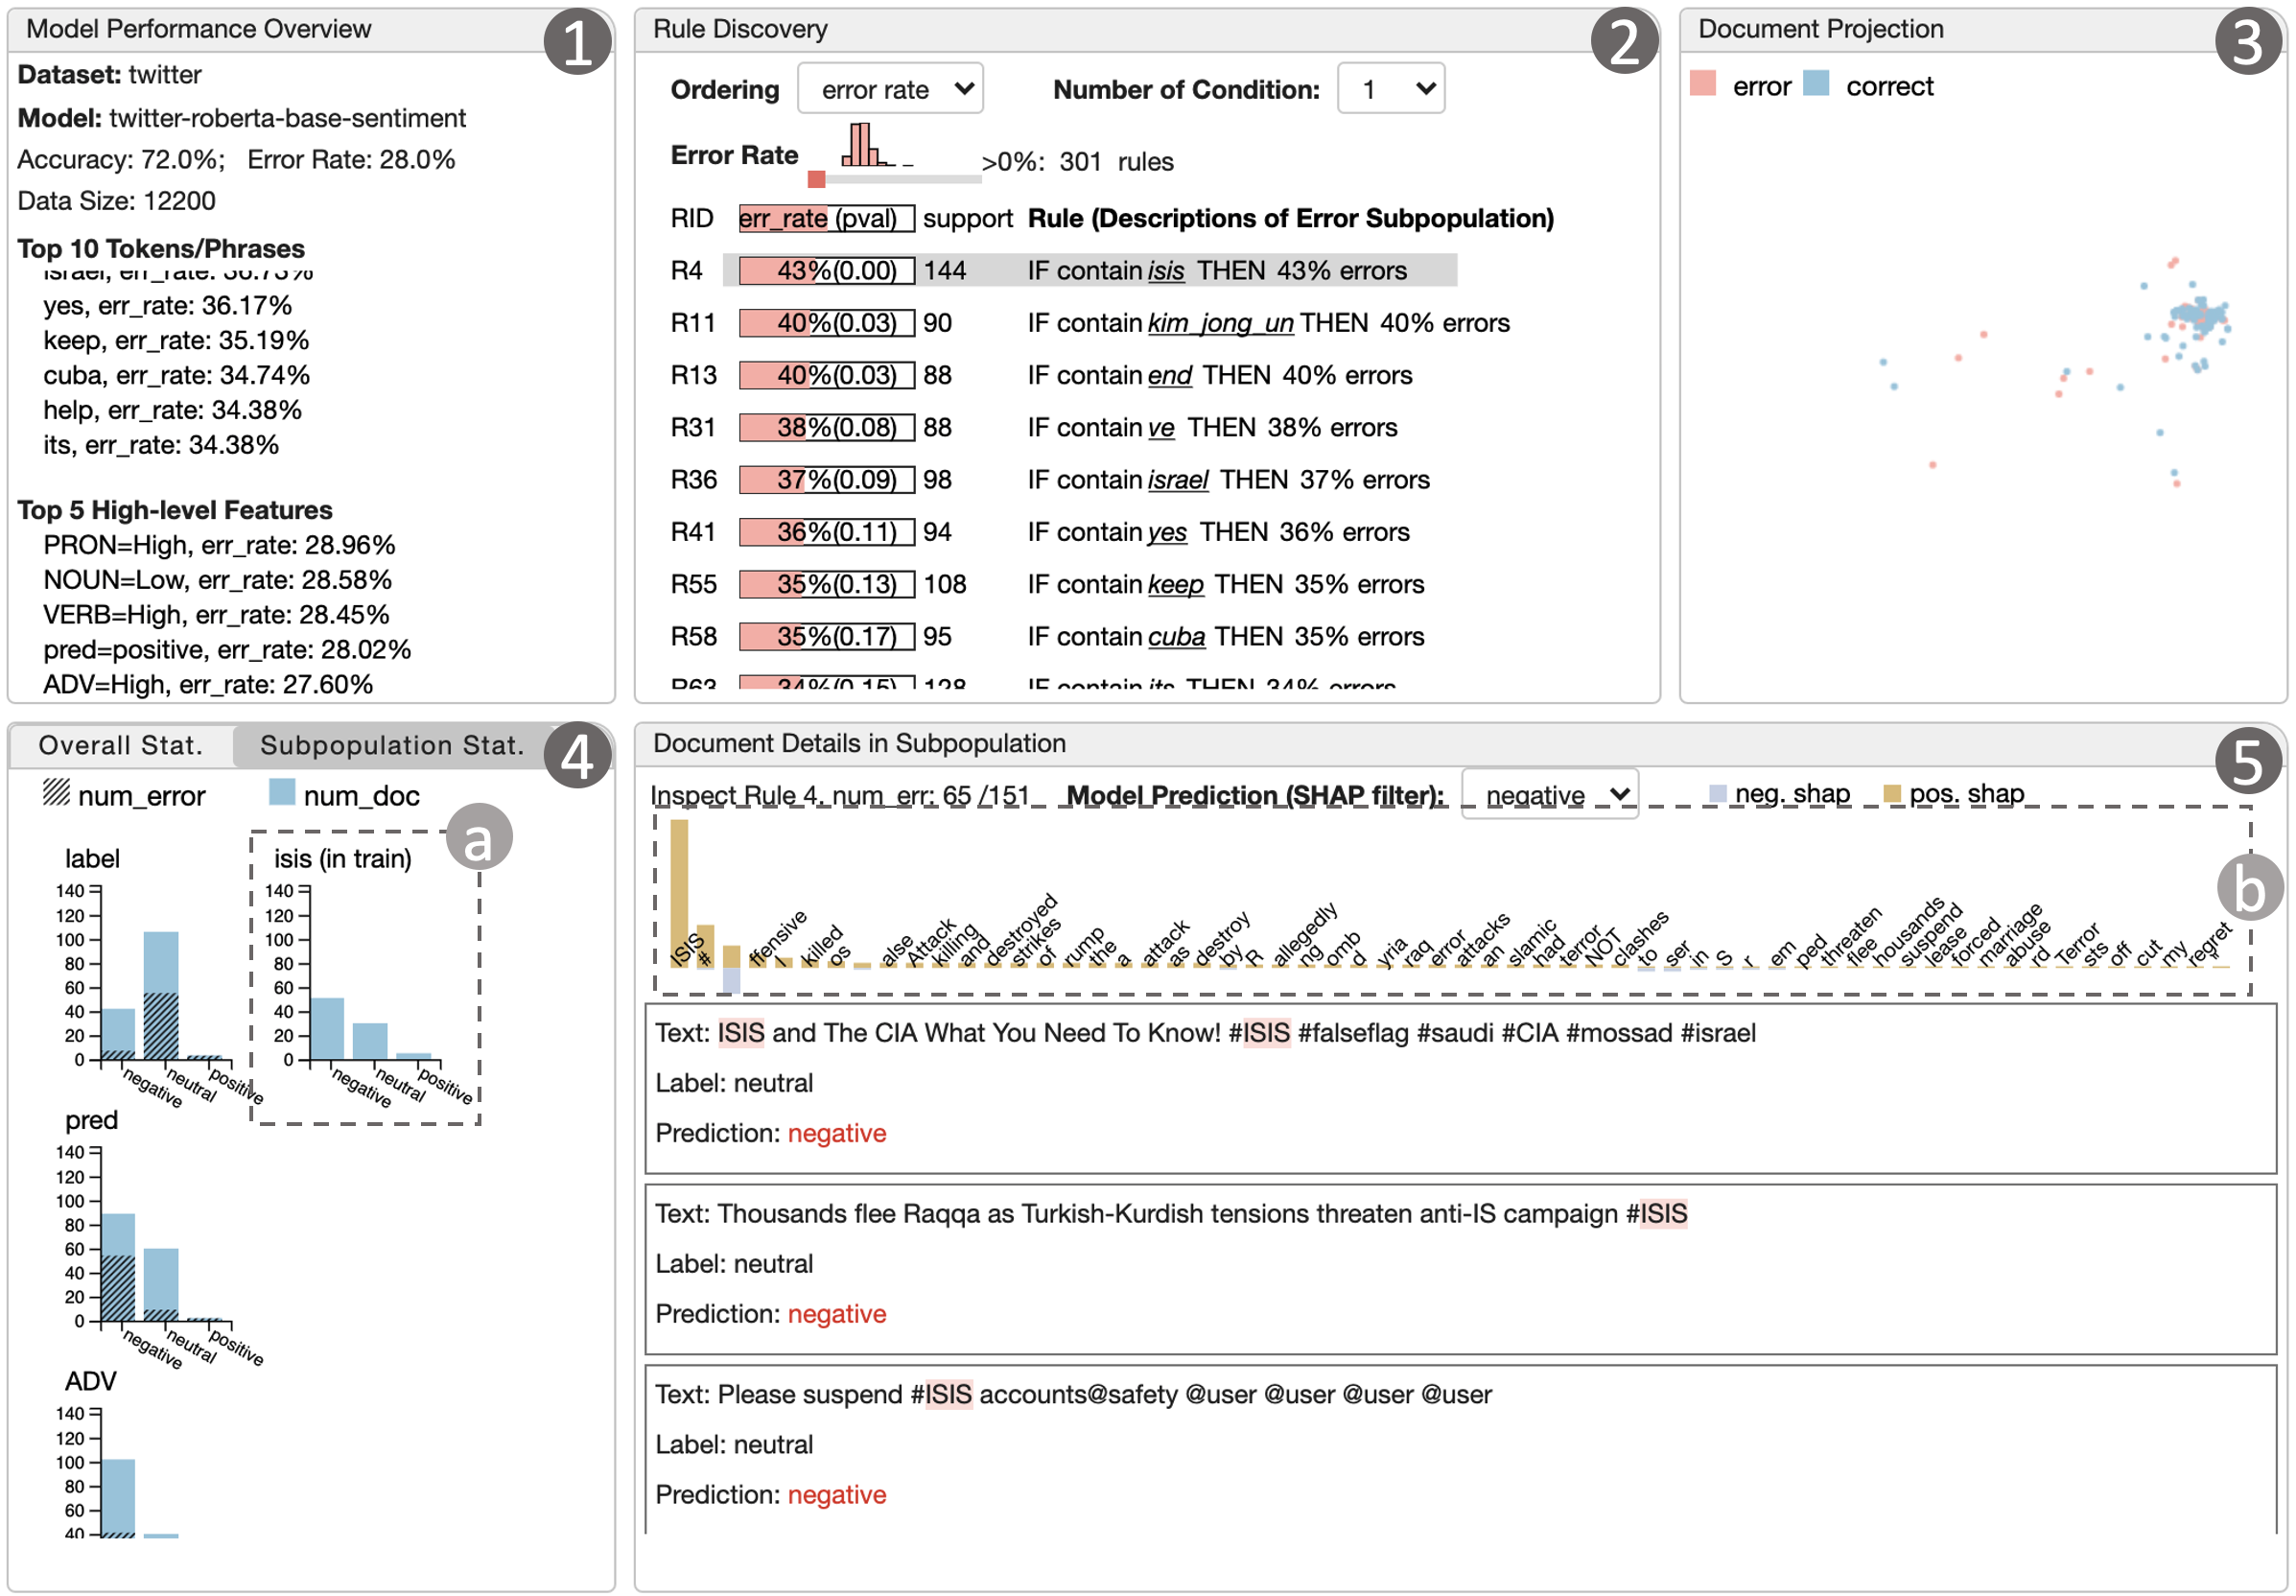
Jun Yuan, Jesse Vig, Nazneen Rajani. ACM IUI, 2022 arXiv / paper / demo / github iSEA is an interactive pipeline for Semantic Error Analysis in NLP Models, which automatically discovers semantically-grounded subpopulations with high error rates in the context of a human-in-the-loop interactive system. |
|
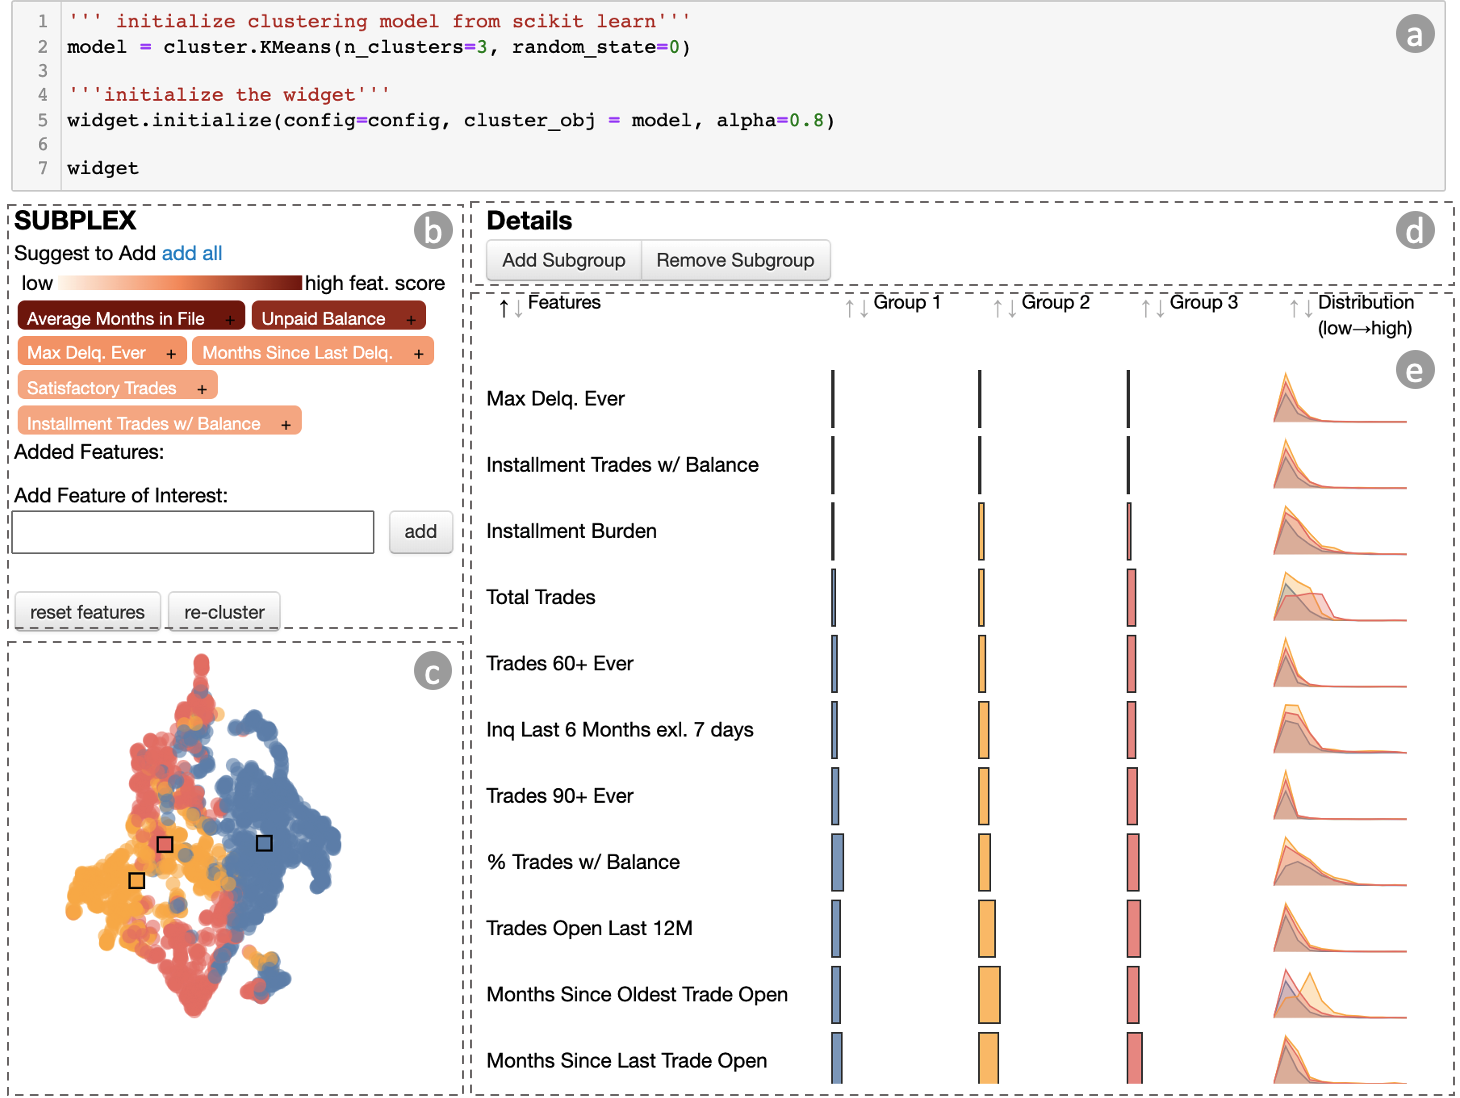
Jun Yuan, Gromit Yeuk-Yin Chan, Kyle Overton, Brian Brian, Kim Rees, Luis Gustavo Nonato, Enrico Bertini, Cláudio T. Silva. IEEE Computer Graphics & Applications (Special Issue on Human-Centered Visualization Approaches to AI Explainability), 2022 demo video / paper SUBPLEX is an interactive visualization widget embedding in Jupyter notebook that enables users to explore and validate local explanations of a model at the sub-population level. |
|
Jun Yuan, Enrico Bertini. Workshop on Human-In-the-Loop Data Analytics (HILDA), ACM SIGMOD, 2022 paper / talk / slides In this work, we first identify two main components of context to assist model diagnosis through literature reviews. We then present Context Sight, a visual analytics system that integrates customized context generation and multiple-level context summarization. |
|
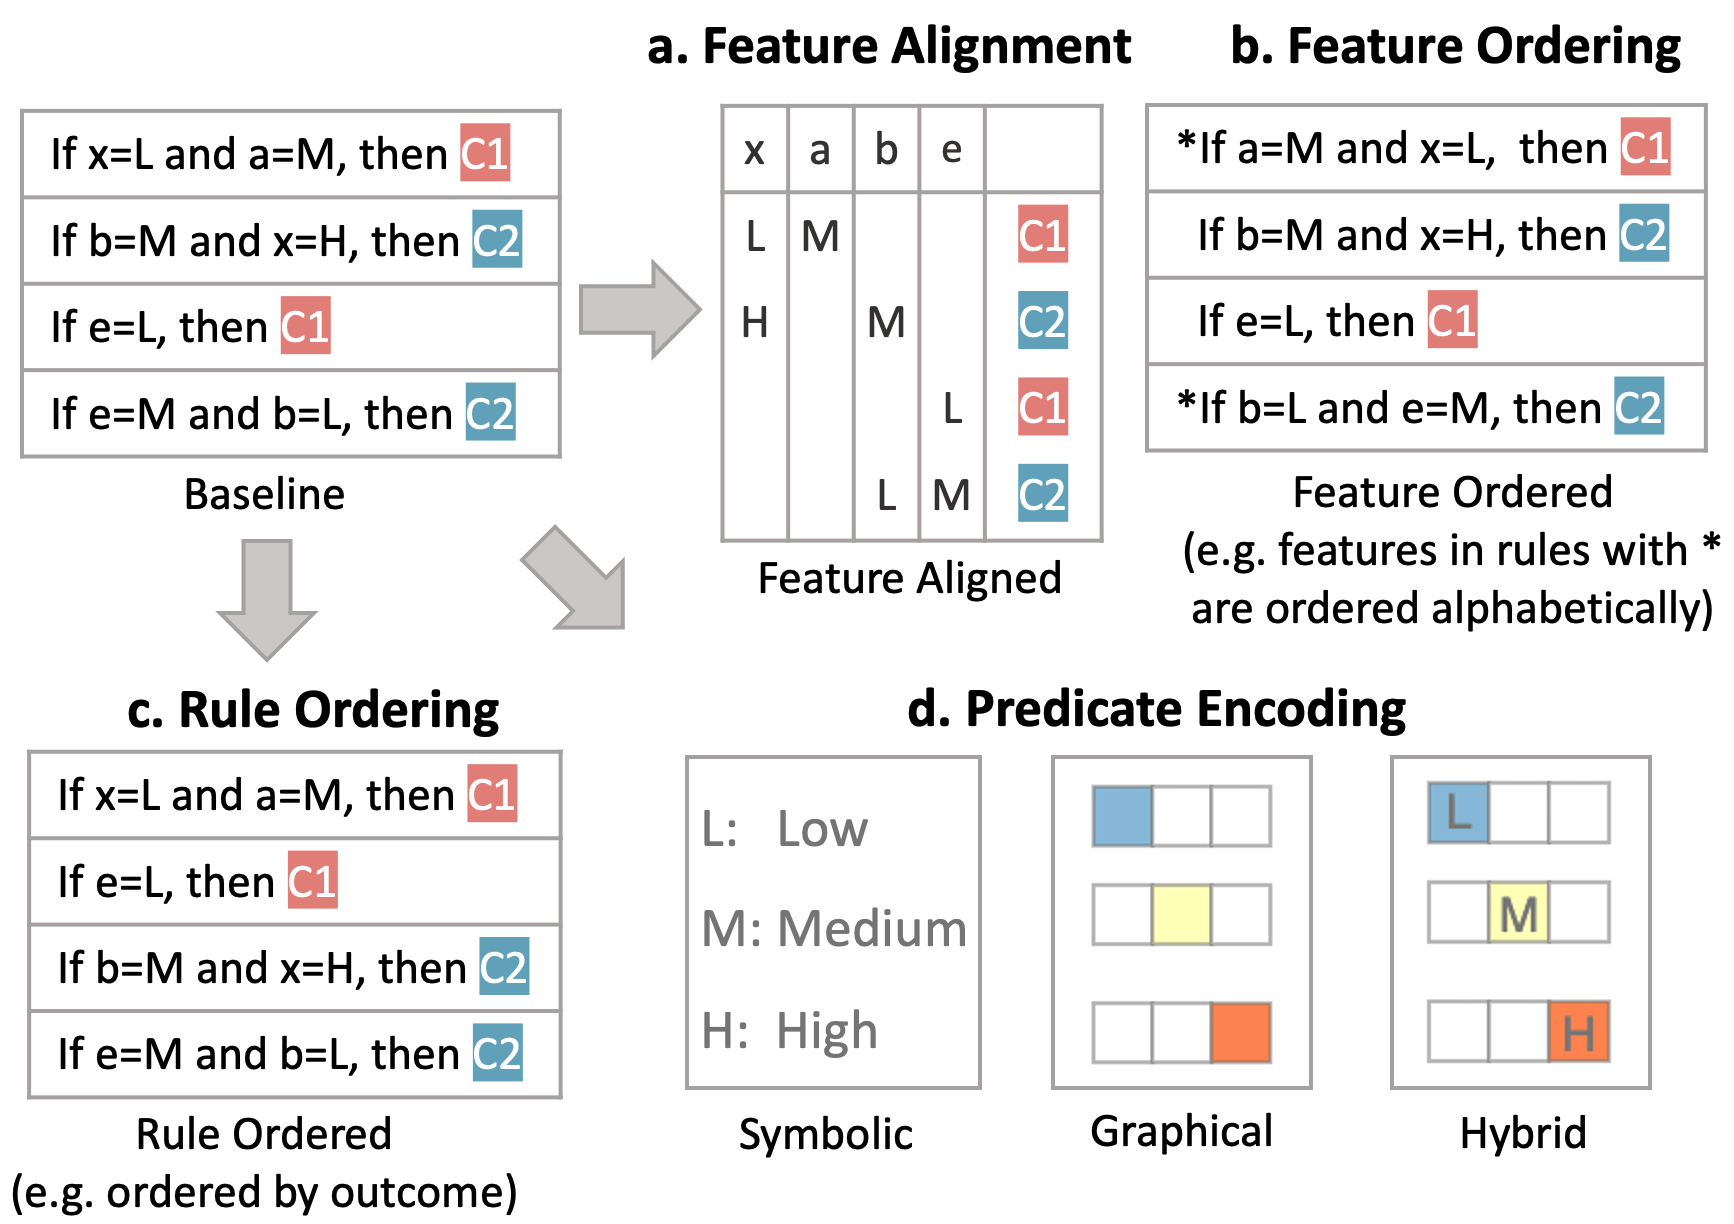
Jun Yuan, Oded Nov, Enrico Bertini. IEEE VIS, 2021 arXiv / paper In this paper, we explore the idea of designing alternative representations of rules, focusing on a number of visualfactors we believe have a positive impact on rule readability andunderstanding. We then presents a user study exploring their impact. |
|
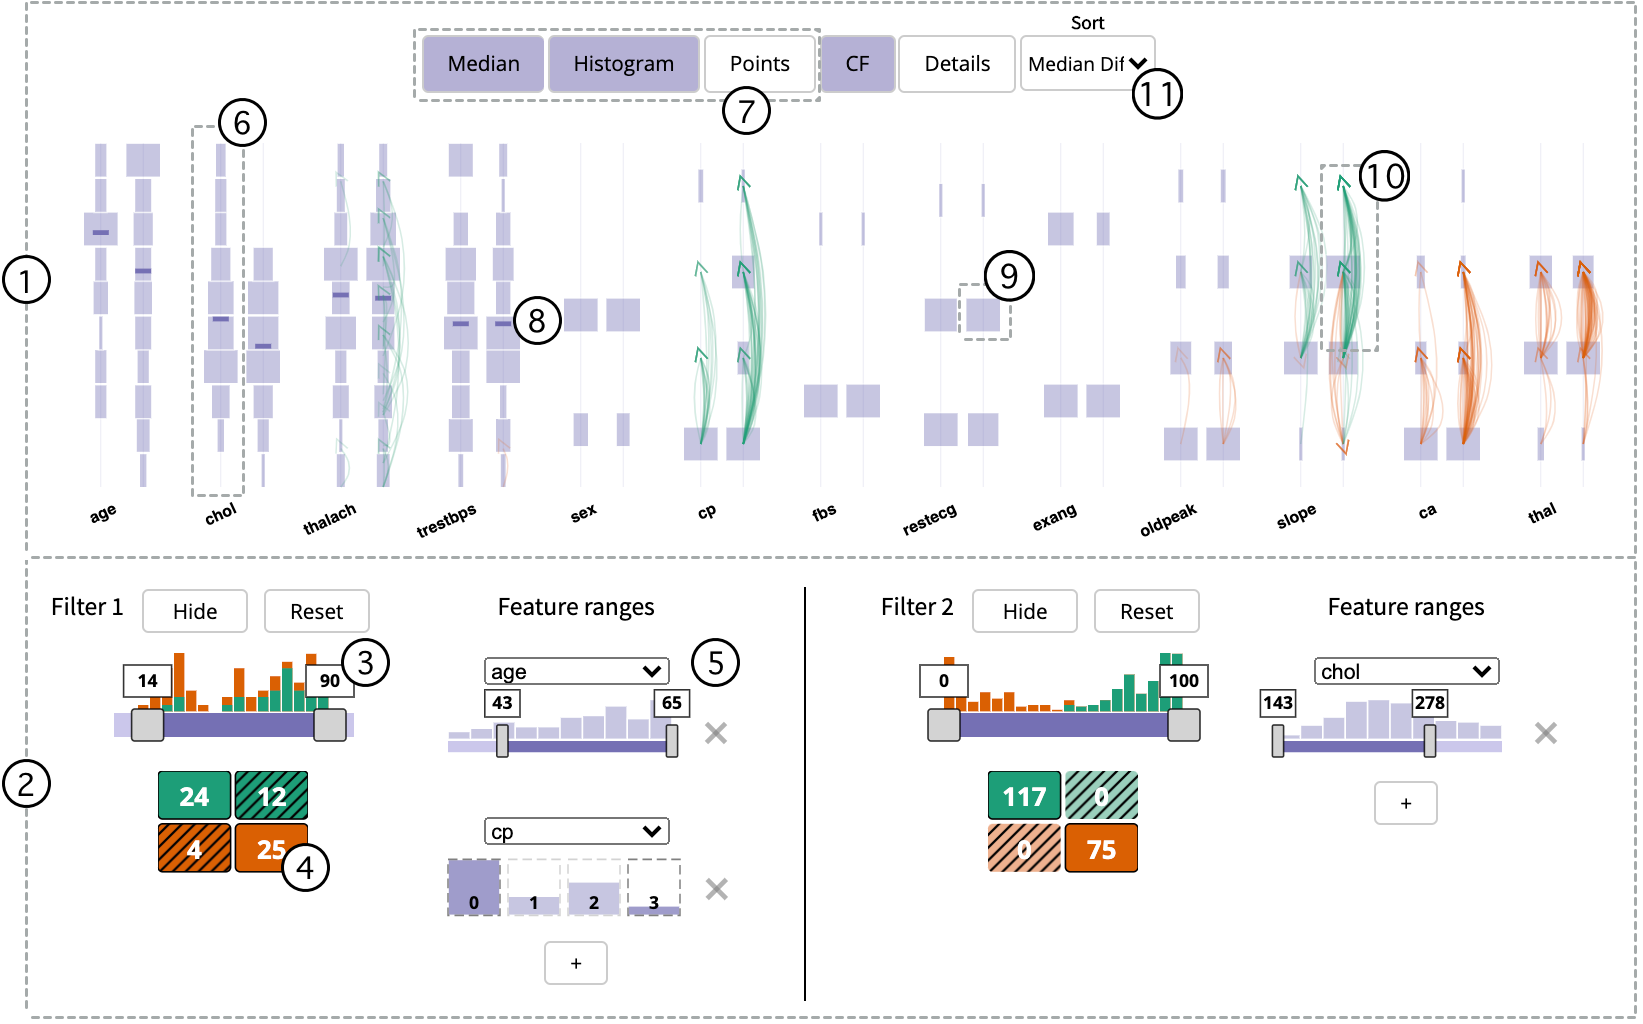
Oscar Gomez, Steffen Holter, Jun Yuan, Enrico Bertini. IEEE VIS, 2021 arXiv / paper AdViCE is a visual analytics tool that aims to guide users in black-box model debugging and validation through counterfactuals. |

|
Jun Yuan, Bilal Alsallakh, Narine Kokhlikyan, Vivek Miglani, Orion Reblitz-Richardson. Rethinking ML Papers - ICLR 2021 workshop, 2021 website / video Bilal Alsallakh, Narine Kokhlikyan, Vivek Miglani, Jun Yuan, Orion Reblitz-Richardson. ICLR, 2021 (Spotlight) arXiv / paper |
|
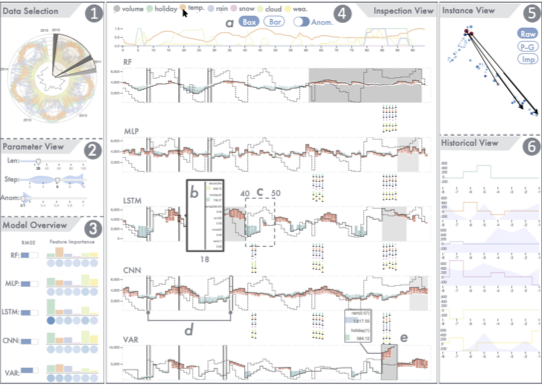
Ke Xu, Jun Yuan, Yifang Wang, Claudio Silva, Enrico Bertini. SIGCHI, 2021 paper / video mTSeer is an interactive system for the exploration, explanation, and evaluation of multivariate time-series forecasting models. |
|
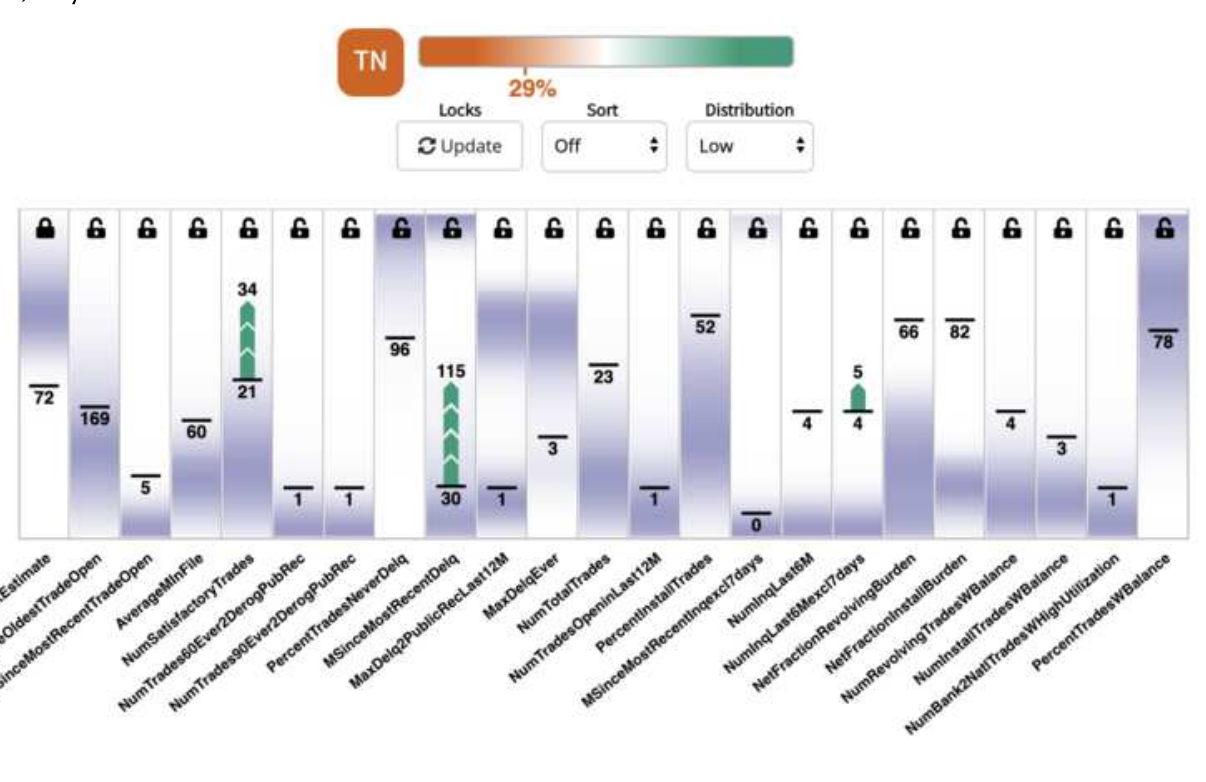
Steffen Holter, Oscar Gomez, Jun Yuan, Enrico Bertini. ACM IUI, 2020 paper / code ViCE is an interactive visual analytics system integrating counterfactual explanation generation and exploration to contextualize and evaluate model decisions. |
|
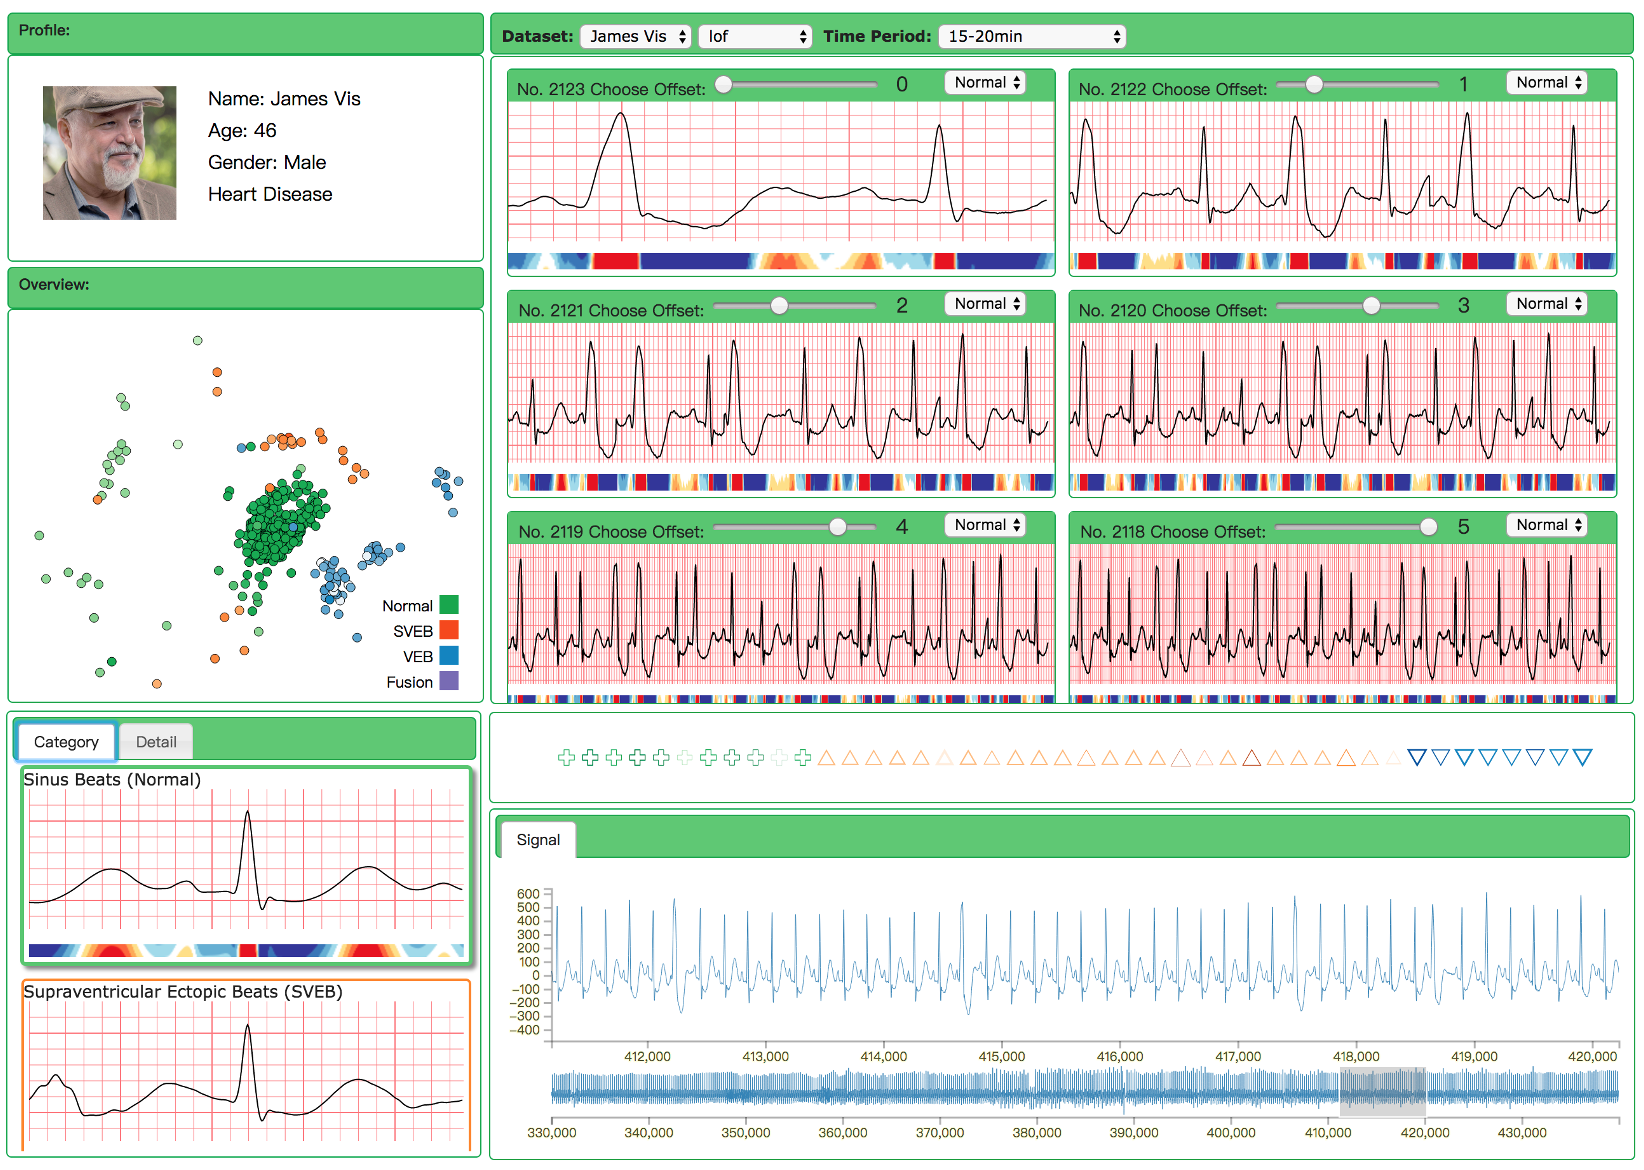
Jun Yuan, Siyao Fang, Xiang Huang, Nan Cao. IEEE VIS, poster, 2017 paper / video ECGLens is an interactive visual analytics system assisting users to inspect anomalous ECG signals (heartbeat, time-series). |
|
|
June 2024, invited lecture at UC Berkeley, class DS100 (Summer'24), "Visualization II". [🎥 / 📝]
April 2022, invited lecture at The College of William & Mary, class CSCI780 Data Visualization, "Visualization for Machine Learning Explanations".
October 2020, presentation at Doctoral Colloquium of IEEE VIS 2020, "Interpreting Black-box Machine Learning Models By Visually Exploring High-Fidelity Surrogate Rules".
|
|
| Program Committee | VIS Short Papers (22, 23, 24), PacificVis Vis-Meets-AI Workshop (24, 25) |
| Reviewer | TVCG, CG&A, SIGCHI (19, 22, 23, 24), VIS (19, 20, 22, 23, 24), CSCW (20, 21), ICML (20), ChinaVis (22) |
| Student Volunteer | VIS (20, 21, 22) |
| Mentor (for Research) | NYU Undergradate Research Program (19,20,21) |
| Mentor (for K12 STEM Education) | ARISE (18, 20), 1000 Girls, 1000 Futures (18) |
|
|
| 22'Fall, 19'Fall | Graduate Student Instructor | CS-GY 6313 Information Visualization |
| 22'Spring | Graduate Student Instructor | CS-GY 9223 Visualization for Machine Learning |
| 20'Spring, 19'Spring | Graduate Student Instructor | CS-GY 6323 Visual Analytics |
|
|
| 17'Spring | Teaching Assistant | Network Virtual Environment and Computer Application |
| 16'Fall | Teaching Assistant | Programming |
|
Website adapted from Jon Barron |